


Satisfaction in bus services in England has risen from 83% to 85%, according to the 2025 edition of Transport Focus’s Your Bus Journey survey.
The annual survey of 47,863 passengers in 43 areas in England outside London, and 3,342 passengers in Scotland provides feedback on more than 50,000 journeys.
Overall satisfaction picked up a further two percentage points in England following an increase from 80% as per the 2024 survey.
In Scotland, overall satisfaction improved markedly from 86% in 2024 to 91% in the latest survey.
However, results continued to show widespread differences geographically.
Greater Nottingham and Warwickshire fared best with journey satisfaction rated at 93%. Meanwhile, passengers in Thurrock, which has been one of the best-performing in terms of patronage rise post-pandemic, were the least satisfied (73%).
Greater Manchester, where the roll-out of franchised bus services was completed last year, showed the biggest improvement, rising from 79% to 86%. Lancashire and Blackburn with Darwen both improved by six percentage points to 89%.
Among fare-paying passengers, satisfaction in journey cost fell back notably from 73% to 63%. Transport Focus notes the £2 bus fare cap, which gave way to the £3 equivalent in December 2024, as responsible for a previous rise in this metric. Greater Manchester enjoyed a rise in fare satisfaction from 63% to 79%.
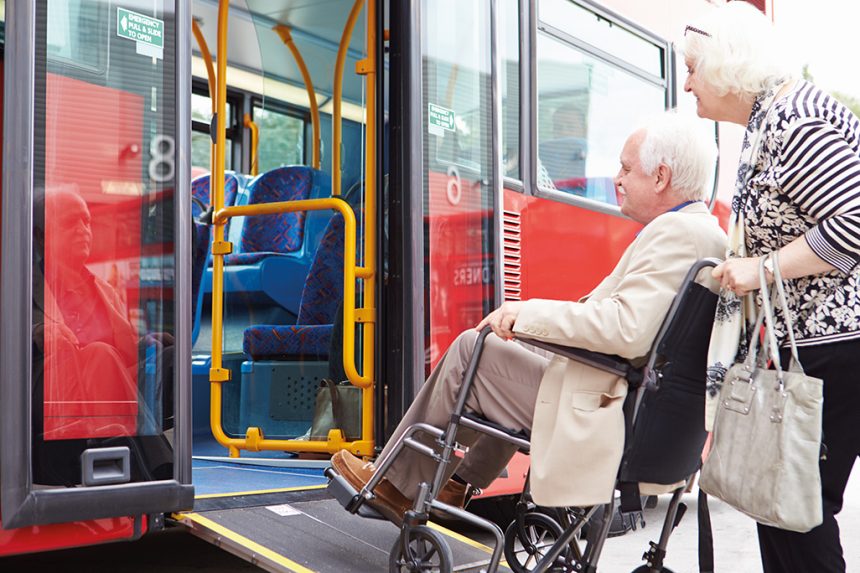
The survey’s authors also point out a broadening gap in feedback from disabled and non-disabled passengers. While non-disabled passengers are happy with 87% of journeys, the corresponding figure for disabled passengers is 83%.
Wales did not take part in the survey this year.
As of 2026, all local authorities in England outside London will be required to participate in the Your Bus Journey survey as a condition of receiving Local Authority Bus Grant funding.
Other key findings of the Your Bus Journey survey
- Arriva in Tees Valley was the lowest-ranking operator with 75% satisfaction.
- Satisfaction with bus-stop punctuality increased from 75% to 77%.
- On value for money, passengers in Warrington were most satisfied at 84%, while those in Plymouth were least satisfied at 46%.
- Satisfaction with journey time was found to be 83%. On this, Warwickshire best with 94%; Thurrock ranked lowest with 70%.
- Passengers with disabilities were satisfied with 83% of journeys – an improvement on the 82% in 2024.
- Satisfaction with bus stop personal security has decreased from 75% last year to 67%.
Louise Collins, Director at Transport Focus, says: “It’s great to see the basics getting better for passengers, with more reliable services and better bus stops.
“This year’s rise in satisfaction shows what can be achieved when governments, local authorities and operators work together and listen to what passengers tell us.
“But there’s still work to do. Value for money has slipped, some areas are racing ahead while others lag behind, and disabled passengers continue to have a worse time than others.
“We’ll be using the insights from our Your Bus Journey survey to keep pushing so improvements are felt everywhere, by everyone.”
Graham Vidler, Chief Executive of the Confederation of Passenger Transport (CPT), adds: “Buses are Britain’s favourite form of public transport, delivering more than 11 million journeys a day.
“It’s very encouraging to see satisfaction on the increase, with 85% of passengers happy with their journeys in England according to the latest Your Bus Journey survey.
“The vast majority of customers are positive about journey times, waiting times and punctuality – demonstrating that swift, reliable, comfortable bus journeys are the norm. It’s particularly pleasing to see that 87% are impressed by the job done by Britain’s 82,000 hard-working bus drivers, with those in rural areas proving especially popular.
“There are areas for improvement. Improving accessibility and ensuring passengers feel safe need to remain a priority for bus operators and local authorities, given the slightly lower satisfaction rate reported by disabled passengers and the decline in reported personal security. And inevitably, an increase in the English national bus fare cap is reflected in perceptions of value for money.
“Overall, this is testament to the tremendous job done by bus operators across the country in getting people to work, to education or simply to access local services every day.”
Paul White, Director, CPT Scotland, adds: “The survey results show that more than nine in ten Scots are satisfied with the daily bus journey. It’s great to see overall satisfaction rising significantly, along with improved perceptions of drivers, punctuality and waiting times.
“There are areas for improvement. Personal security on board and at the bus stop must remain a priority for bus operators and other stakeholders, including local authorities. Likewise, improving accessibility should be a shared focus, given the slightly lower satisfaction rate reported by disabled passengers.
“Concerningly, 26% of the more than 900,000 daily bus journeys in Scotland are reported as delayed. Measures to improve bus speeds by tackling congestion and reducing the impact of roadworks will result in faster journey times and improved reliability, potentially further improving what are already UK-leading passenger satisfaction figures.”