


Welcome to the first in Switched On, a series of articles written to help you navigate fleet electrification.
Having worked with pioneering electric fleet operators since 2019, supporting thousands of their vehicles, Zenobē would like to share what we have learned about driving down the lifetime costs of electric.
We hope that the series will help decision-making across the industry – and of course, you can always ask us if you have any questions.
Steven Meersman, Co-Founder and Director, Zenobē
TCO analysis: A tool to understand a business case
Total cost of ownership (TCO) is nothing new. For decades, fleet operators have used that approach to understand the lifetime costs of different vehicle types and different financing structures.
It is now, however, widely accepted as the best – not perfect, but the best – tool for understanding and exploring the business case for switching from diesel vehicles to electric. But how does it work? In this article, we will talk through the basis of electric fleet TCO analysis, with more detail provided in future articles.
The basics for electric fleet TCO analysis
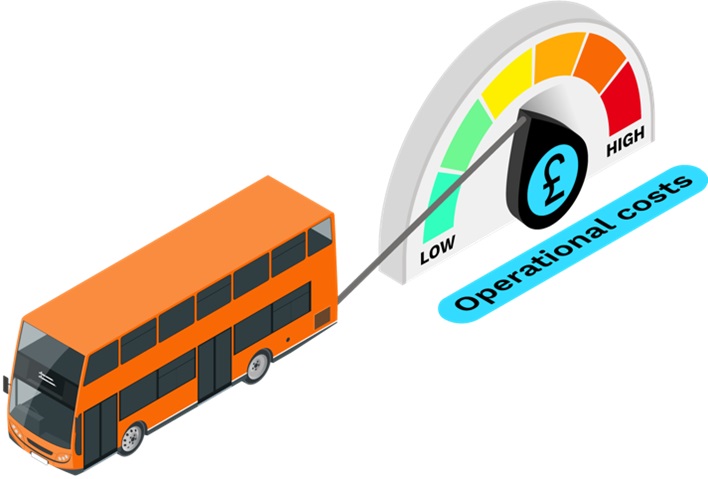
Electric vehicles are around twice the cost to purchase than a diesel, but they run on fuel that is currently around one-third of the price per mile driven. Fundamentally, it is the operating costs that can bring electric vehicles to parity. But how do you compare like for like?
Electric fleet TCO analysis looks at the main cost drivers over the whole life of the vehicle. These are:
- Assets – battery, vehicle, and infrastructure
- Fuel
- Maintenance.
It then boils them down into a single pounds-per-mile amount, to enable a like-for-like comparison across fuel types, vehicle models, contract structures, financing structures, and so on.
To take account of the time value of money, most models look at the net present value (NPV) of the cost per mile, assuming a stated discount rate that takes inflation and other factors into consideration.
A worked example of TCO
For the purpose of this article, we have created a working example based on certain assumptions to show both capital expenditure and TCO:
- A double-decker bus working city routes
- The electric bus has a c.£500,000 purchase price (of which £150,000 is the battery) and an energy consumption of 1.2kWh per km
- The diesel bus has a c.£250,000 purchase price and a fuel consumption of 6mpg
- Each bus travels 45,000 miles per year.
We will come back to this example, and others, throughout the series.
As you can see below, compared on capital expenditure alone, electric is between 2-2.5 times more expensive than diesel. However, by switching to a TCO model, you can close the cap. In our worked example, electric can be 7% less per mile on an NPV basis.

- From ‘Analysis to provide costs, efficiencies and roll-out trajectories for zero-emission HGVs, buses and coaches’, Element Energy.

Cost drivers examined in more detail
Assets – battery, vehicle, and charging infrastructure
As mentioned, electric vehicles can be around twice as expensive to buy upfront as their diesel equivalents. Moreover, once the operator has factored in infrastructure and a replacement battery, the capital expenditure (not the pounds-per-mile) cost of an electric vehicle is closer to 2.5 times more expensive.
In real life, operators manage these costs through financing and as-a-service models, which we will discuss in later articles. In terms of TCO, one way to reduce both the net capital expenditure and therefore the costs of financing is to work with a specialist lessor (like Zenobē).
Degradation means that a battery will probably need to be replaced at least once in a vehicle’s life, leaving the operator exposed to battery market prices. Specialist lessors like Zenobē will take on this risk, retaining ownership of the asset through a battery-as-a-service model, or as we call it, a battery managed service.
A commercial value is assigned to the first replaced battery, which can be passed onto the operator, reducing the monthly fee.
In the Zenobē electric TCO model and examples within this article, we use our as-a-service financing costs to calculate the TCO cost per mile of the assets.
Fuel
Forward curve market data sourced from the Department for Energy Security and Net Zero shows that driving an electric bus is 30-40% cheaper per mile when compared to diesel. Higher mileage routes will naturally favour electric TCO, but even on lower annual mileages, the operational savings over a 15-year period are significant.

Electricity costs can be further reduced as operators get into the details of their decarbonisation plan.
Think about installing smart charging software, improving driver efficiency with training, on-site battery storage, and bespoke power procurement management. We will share more on these in a future piece.
In the Zenobē electric TCO model and examples within this article, we use forward curve market data but assume no further optimisation.
Maintenance
With fewer moving parts, reduced maintenance requirements are often cited as an additional upside for electrification. But it is not just the projected 10-30% reduction in maintenance costs that make this compelling.
Instead, it is the expected longer economic life for electric buses compared to diesel, and the reduction in maintenance time (potentially meaning fewer spares are needed) that make such a persuasive case to switch.
In the Zenobē electric TCO model and examples within this article, we assume 30% lower maintenance costs. We do not take spare vehicles into account in either the diesel or electric calculations.
Two exclusions: There are two elements that we have excluded from these examples:
Grid upgrade costs: Grid upgrades are often required to ensure adequate on-site power to charge an electric fleet. The reason for excluding them in the analysis is the level of variability between electrification projects.
Quotes for the same-sized upgrade can range from four to seven digits, and the only way to find out how much it will really cost to upgrade a particular connection is to make an application.
Subsidies: Lump sum grants continue to play an important role in driving decarbonisation, but their days are numbered. The latest Scottish Government funding programme was described as the final round, and Germany recently announced it was cutting its subsidies.
They are excluded from our example because they cannot be standardised, but for now they still play an important role when looking at specific projects.
Per-mile payments also make a difference, but they vary hugely between England (Bus Service Operators Grant, with a per-kilometre figure for zero-emission); Scotland (Network Support Grant, with no extra incentive for zero-emission); and Wales. As currently structured, they are subject to review and change as policy evolves, so they are excluded from the example.
What are the key takeaways from TCO analysis?
Total cost of ownership is not a catch-all, but it does give an operator a better understanding of the business case for switching from diesel to electric.
In 2024, we may not be at TCO parity across all services or depots. But the gap is closing. In the following series of articles, we will share with routeone readers the key opportunities presented by going electric – with deeper dives into charging optimisation, battery risk, adapting to new technology, and more. All from real, hands-on experience to date.