


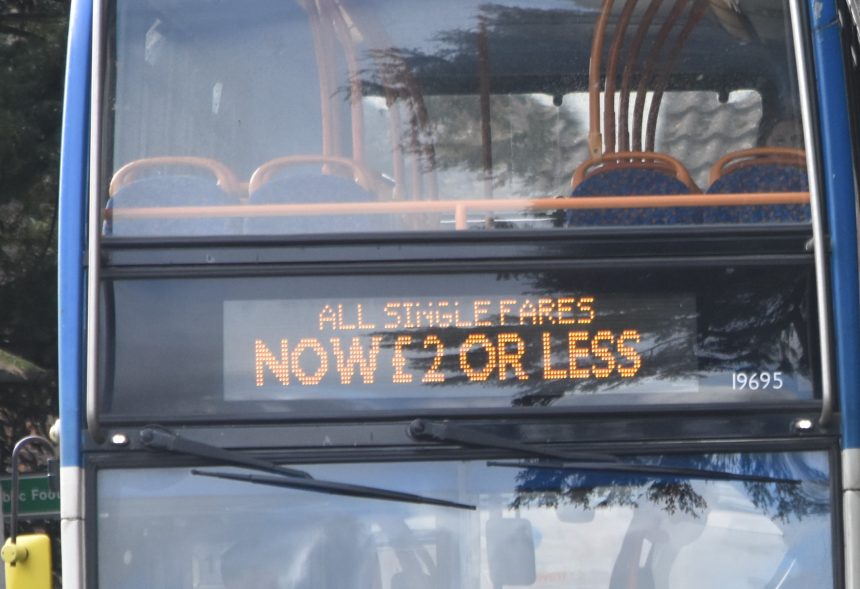
Department for Transport quarterly statistics have shown, for the first time, the effect of the £2 single fare cap, with a 7.9% year-on-year decrease seen in England outside in London.
The statistics, which compared local fares in March 2022 with those in March 2023, revealed a 1.7% increase in Scotland, a 3% increase in Wales and a 6% increase in London – all areas in which the Bus Fare Cap Grant scheme is not in operation. The Consumer Price Index (CPI) increased by 10.1% over the same 12-month period.
A 4.3% decrease in metropolitan areas outside London was dwarfed by an 11.4% reduction in non-metropolitan areas outside the capital, where the capping scheme, which was in May extended until at least November 2024, is having the biggest impact.
Between December 2022 – just before the fare cap began – and March 2023, fares in England outside London dropped by 9.4%. In Scotland, prices did not change over this period, whereas Wales saw a 2.5% increase.
In real terms – where figures are adjusted for inflation – fares dropped by 10.7% across the whole of Great Britain in the 12 months up to March 2023. In England outside London, the decrease was 16.3%.
Fares went down by 10.7% in England outside London in the three months to March 2023 in real terms. The situation contrasts with London, where there was a 4.6% hike by this measure.
In English non-metropolitan areas, the price cap helped push bus fares below 2005 levels in real terms for the first time since 2008 – at 4.6% below that 17-year-old reference figure. Overall across Great Britain, prices are 10.3% higher than in 2005 in real terms but at the lowest level seen since 2009.