There is an overall north-south divide in England as far as buses’ prosperity goes. That perhaps obvious fact was exposed by DfT when it published annual bus statistics for the year ending March 2019.
The data includes passenger numbers for each English local authority (LA) area, plus London, on a yearly basis back to 2009/10. Other figures include mileage covered and concessionary pass usage.
In England including London, patronage dropped by 6.4% over that period, to 4.318bn journeys. Outside London, the drop was 10.7% during that time. But between 2017/18 and 2018/19 things changed. In England outside London, overall patronage stabilised. Within London, it dropped by 1.2%, or by 27.5m journeys.
While the message outside the capital is not one of unbridled positivity, the fact that patronage has been steadied is an important one. That is particularly so as the deregulated industry goes into 2020 facing an unprecedented level of political scrutiny.
Imperative to note is that none of the figures collected are operator specific. They aggregate total usage in each area. Thus, some operators will have seen the opposite results to what is portrayed on a general basis.
In particular, some of those in the north of England have seen, and continue to see, growth against an overall background of decline in that part of the country.
Bus statistics show contrasting north/south data
Regardless of that, for some operators in the north of England, the figures will be frightening. No English LA area north of Nottingham has seen a net increase in bus usage since 2009/10. Most reported a double percentage point decrease.

For the south of England things are significantly better. In the South East region excluding London, 10 out of 19 LA areas saw patronage rise over the same period.
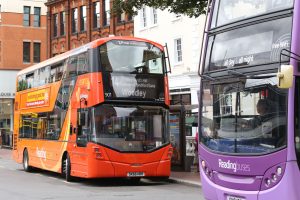
The region’s overall level of bus use also grew by 5.1%. Both Reading and West Berkshire saw numbers rise by over 35%.
In the South West, things are even more positive. Overall, passenger numbers there rose by 7.7% since 2009/10. Eight of 15 LA areas saw rises, including England’s stand-out performer, Bristol.
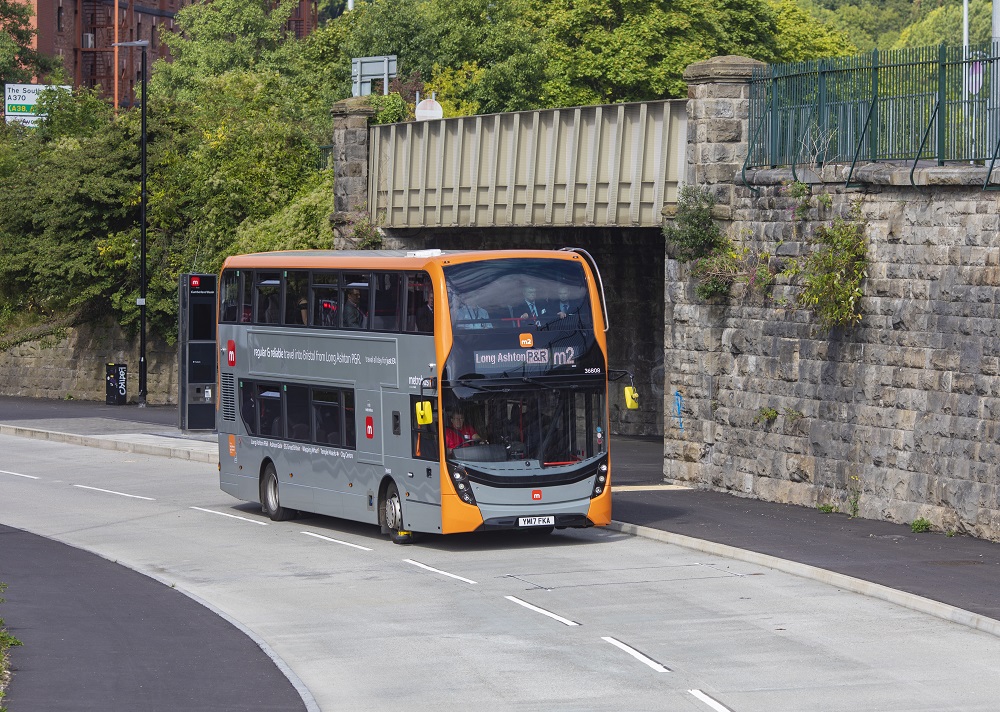
Between 2009/10 and 2018/19, bus usage in Bristol rose by 52.3%. Operators there carried 42.8m passengers in the most recently measured year. In the same region, Bath and North East Somerset, North Somerset, Poole, and South Gloucestershire also turned in strong increases during that period.
East of England’s performance is reasonable
Performance in the East of England was moderate. The DfT bus statistics show that the region recorded an overall 6.2% drop in passengers since 2009/10.
However, four of the 11 LA areas there saw increases. Numbers in Central Bedfordshire, albeit from a low base, grew by 39.3%. Luton and Norfolk saw patronage rise by 16.3% and 3.3% respectively.
A very strong performer was Thurrock. Usage there grew by over a quarter. Perhaps a more positive note for the East of England overall is sounded by the most recent annual figures. From 2017/18 to 2018/19, eight of its 11 LA areas saw rises.
Moving northwards: Prosperity starts to wane
Heading further north, the picture becomes less positive. In the West Midlands region, every LA area saw a double-digit percentage point drop in patronage between 2009/10 and 2018/19. In Stoke-on-Trent, 40.4% of passengers were lost. Percentage wise, that was the second worst return in England.

A better more recent picture is in the West Midlands Integrated Travel Area (ITA), where partnership working is strong.
While patronage dropped between 2009/10 and 2017/18, a resurgence was then seen. It grew by 3.0% in the most recent 12-month period, the bus statistics show. Usage in Shropshire also increased during that time.
In the East Midlands, Nottingham saw a 3.3% rise in usage to 49.6m journeys per year since 2009/10. Per head usage in the city is second only to Brighton and Hove outside London. Rutland saw a 35% rise, but its baseline is so low that the actual number of passengers grew to only 400,000 per annum.
Leicester, Leicestershire and Lincolnshire all turned in reductions of over 20%. However, usage in Leicestershire has bottomed out and has increased since 2017/18. In the Derby and Derbyshire LA areas decline has been stabilised; patronage has been identical in both over the last two years.
Decline in the North East starting to stabilise
In Yorkshire and The Humber, overall passenger numbers have dropped by 16.8% to 303.3m since 2009/10. The South Yorkshire and West Yorkshire metropolitan areas saw decline of 21.2% and 14.5% respectively.
However, York is a brighter spot. While overall patronage there has dropped by 1.2% since 2009/10, more recently it has grown by 5.2% since 2013/14. Recent announcements favouring buses will help to drive that further. Hull also shows consistent growth since 2016/17.
In the North East, every LA area has seen a double-digit percentage point drop in bus use since 2009/10. In Redcar and Cleveland, it has slumped by 36.8% and in Darlington by 30.5%.
However, decline in the region has generally been slowed, or stemmed entirely, during the last five years. Except for London, average usage in the North East per head is also the highest of any English region. It was one of three regions where that figure grew in the most recently measured period.
Additionally, Durham, Hartlepool, Middlesbrough and the Tyne and Wear ITA all saw modest rises in usage from 2017/18 to 2018/19. In Northumberland and Stockton-on-Tees, patronage remained static during that time.

A similar story in the North West
The story in the North West is similar. The overall reduction in usage there since 2009/10 is within 0.1% of that in the North East.
However, in half of the North West LA areas journey numbers fell by more than 30%, including in Warrington, which turned in the worst result in England.
It lost 48.1% of its passengers between 2009/10 and 2018/19, although that decline has now largely been stemmed.
Elsewhere in the North West, both Halton and Lancashire have seen modest growth within the most recently measured year.
Halton’s patronage for 2018/19 is back at the same level it was five years earlier. The Merseyside ITA, with the highest per head usage in the North West, saw a drop over the same period that is almost too small to measure.
Lessons to learn in bus statistics?
An overall England-wide decline in passenger numbers will be little surprise in view of congestion, flexible working and the ongoing decline of the high street. But what may be more worrying is the difference between bus statistics in different parts of the country.
Between 2009/10 and 2018/19, increases were reported in just 24 of the 88 local authority areas excluding London that were measured. 18 of those were within either the South East or the South West regions; four more were in the East of England.
Data for the five years between 2013/14 and 2018/19 shows a similar trend. 20 of 88 areas saw rises in patronage. 15 of those were in the South East or South West. 64 areas saw decline during that period. In four, patronage was stable.
Despite those figures, pigeonholing the industry in the north as one in decline and that in the south as one that is on the up is inaccurate. But what the performance in each half of England does demonstrate is that several variables affect ridership, not least the quality of service provided.
Green shoots are emerging in a small number of areas beyond the Midlands, while performance in a small number of areas of the south was dismal.
The largely rural counties of Dorset and Somerset saw large losses of passengers, while others saw strong rises in numbers followed by even more significant losses. East Sussex is an example of that.
A point not lost on the Confederation of Passenger Transport (CPT) relates to patronage changes in areas where partnerships between operators and LAs have flourished in more recent years.
The success of buses in Bristol has already been mentioned, but CPT notes that in the Merseyside and West Midlands ITAs, where partnerships are also in place, usage figures rose between 2017/18 and 2018/19.
Other figures give industry insight
The data generated by DfT gives other insights into the health of the bus market.
A headline figure is usage per head. London triumphs in this measurement, with 246.7 bus journeys per resident in 2018/19. That represents a fifth consecutive year of decline in that metric in the capital.
Outside London, Brighton and Hove is the leader in per head usage. Each resident there made 171.7 bus journeys on average in 2018/19. Nottingham, at 149.7, and Reading, at 137.6, came in second and third respectively. All three of those areas saw per head usage grow in 2018/19. The average figure for England was 77.1.
Unsurprisingly, the number of journeys made by concessionary passholders has dropped in both metropolitan and non-metropolitan areas, although only slightly. In both Wales and Scotland, concessionary pass usage increased.
Vehicle miles operated continued a steady trend of decrease that has been consistent since 2009/10, although at the slowest rate since 2013/14. The figure for the most recent 12-month period in metropolitan areas grew by 1.3%. Outside those, it shrunk by 2.0%. LA supported mileage also dropped.
With those challenges in mind, it’s clear that the past decade has been difficult for the bus industry in England. It now stands on the cusp of change, even if what that means is not yet known. But those positives already displayed show that it at least has something to build on.
routeone comment
Little concrete can be taken from the DfT bus statistics, although they do demonstrate that where LAs take buses seriously, patronage is best placed for growth.
While the overall picture is that buses do better in the south of England, that will not be majorly surprising. That part of the country is more economically prosperous.
But even then, it is not a simple equation. Some areas of the north of England have stemmed losses and are starting to show growth. In the south, while the overall result is generally positive, some parts have seen large drops.
Perhaps what the above does demonstrate is that bus operators have numerous things to consider if they are to see their networks prosper. The overall service they provide is key, but the state of local high streets and the extent of congestion also need to be considered.


